If you’ve been earning extra money by using Bookscouter to sell books online to textbook buyback companies, you’ve probably noticed that many buyback companies tend to purchase the same book titles throughout the year.
These books (which can include classic literature, self help books, and popular science texts) are known as “backlist books” and are considered required reading by several colleges, universities, and book clubs. As a result, buyback companies purchase these books on a regular basis, since they know there’ll always be a market for them.
That said, there will be certain times in a year (or even a month) where the price quotes for these backlist books will rise dramatically in value as buyback companies seek to replenish their stock. So depending on when you sell your book, you could be earning anywhere from $5 to $30 for the exact same copy of the book.
Things get trickier when you come across backlist books experiencing a temporary “dry spell” where no buyback company wants to purchase them – but which may still get a dramatic rise in price a few weeks or a month later.
This leaves you with a dilemma – naturally you don’t want to waste your money on books you can’t sell, but you also don’t want to pass up on a chance to buy several bags of books for pennies and then sell them all for huge profits a few weeks later.
That’s where using Bookscouter’s Price History features can really help you decide which books can help you make the most money.
Studying a Book’s Price History
If you go to Bookscouter’s home page right now and search for a book with its ISBN, you’ll notice two features that show the book’s price history.
The first is the View Price History feature, located right below the book’s publication information. By clicking on this feature, you’ll see a list revealing the maximum price, average price, and number of price quotes for that book over the last couple years.
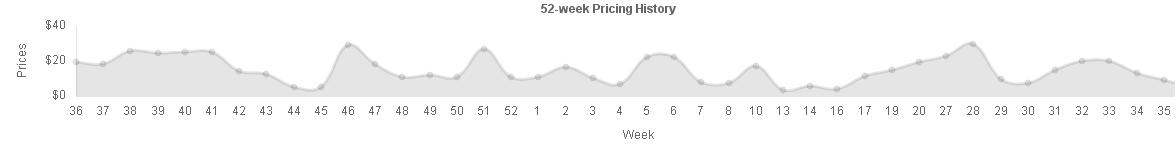
The second is the 52-Week Pricing History graph that appears above all the buyback company price quotes. This graph shows the average price quote for that book for every week in the last year.
I recommend using the 52-Week Pricing History graph when you’re debating on whether or not to purchase a potentially profitable book. You’ll be able to see, at a glance, if that book has been selling for high prices in the past. This will let you quickly decide whether to buy the book or leave it.
One thing I love about using the 52-Week Pricing History graph is that you’ll be able to find books other online book scouts will pass up. Since most book scouts only look at the current price quotes offered by buyback companies when looking up prices on Bookscouter (and not their potential future price quotes), you’ll be able to buy more books to sell for money, which will vastly increase your profits.
Using the 52-Week Pricing History Graph to Make More Money
When looking at the 52-Week Pricing History Graph, you’ll want to watch for certain key signs.
First, check to see if there are any dramatic rises and falls in the book’s price – and if these price fluctuations show up on a regular basis. If the graph reveals that a book consistently sells for $20 every three weeks but then dips down to $2 between these high points, then you’ll probably want to buy the book and wait for it to rise in value again.
On the other hand, if the graph reveals that a textbook was selling for $20 six months ago but has been steadily dropping in value over the last several weeks, you’ll probably want to pass it up (or sell it quickly if you can still make a profit).
Also, don’t underestimate your own hunches. If you’ve been selling the same copy of the book multiple times to buyback companies over the last several months, odds are that title will continue to be in demand – which should factor into your decision to buy or pass up a book.
Selling Potentially Profitable Books
If you do end up buying a bunch of potentially profitable books, be sure to keep them in a box next to your laptop. You can look up their current price quotes on Bookscouter while you’re selling your other books – which will help make sure you sell them for their highest price.
And if you find you can’t sell some of these books – don’t worry. You can still profit off of them (read my article How to Make Money From Books You Can’t Sell Online to find out how).
Final Thoughts
In general, while I find Bookscouter’s Price History feature to be a useful way to spot more books to sell online for cash, it can be confusing for someone who’s just started selling books online. For this reason, I consider using Price History an intermediate technique for book scouts who are already comfortable making money by selling books online and want to increase their profits even more.
So if you’re new to this business – stick with learning the basics. Read my article How to Make Extra Money Every Day “Flipping” Books Online to get familiar with the concept of “flipping” books for profit. Learn which buyback companies are the best ones to sell to (I recommend Textbooks.com, Sell Back Your Book, eCampus, and Cash 4 Books) and pay close attention to the condition these books should be in to make you money.
Then, once you start making some money by selling books online (trust me, it won’t take long), start using more advanced techniques like Bookscouter’s Price History. You’ll be amazed by how much you’re profits will increase!
Want to receive more tips and tricks for how to sell books online for extra money? Subscribe to my blog!
Do you have a question or suggestion for a future blog article? Email me at sellbooksfastonline@gmail.com.
Michael J. Jung
Michael J. Jung is a professional freelance writer for hire. He loves learning about new side hustles and promoting nonprofit groups. When he's not writing or selling books, you can find him volunteering as Darth Vader or Spider-Man for children's events. Check out his Sell Books Fast eBook series on Amazon!